After great success working with Drinkaware on their DrinkCompare calculator we were tasked with bringing a new digital tool to life.
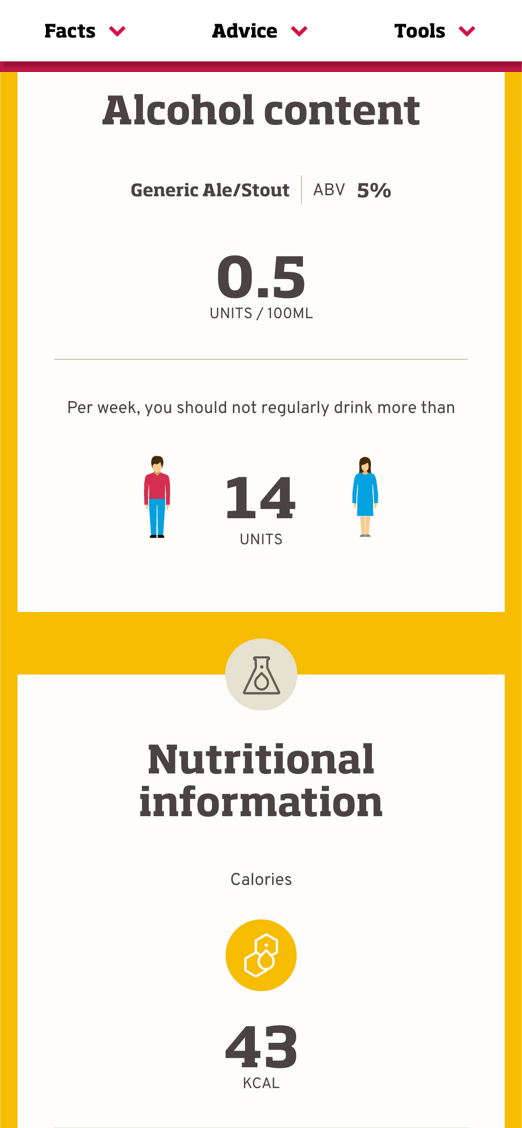
The new application was aimed at giving the public a better understanding of what was in their drink. Not just alcohol content but nutritional information to allow people to understand what other effects drinking would be having on their lives.
Drinkaware wanted to become the go-to place for drink data, as well as continuing their mission of helping people stay better educated about their drinking.
MVP scope
Partnering with Drinkaware’s development team we helped scope out the paths through this new tool detailing what should go into our MVP, ready for iteration and development after first release.
Collecting an immense amount of data from brand partners was a challenge. We created a system that was easy to use, with a robust system for data entry in the background.
Using common patterns
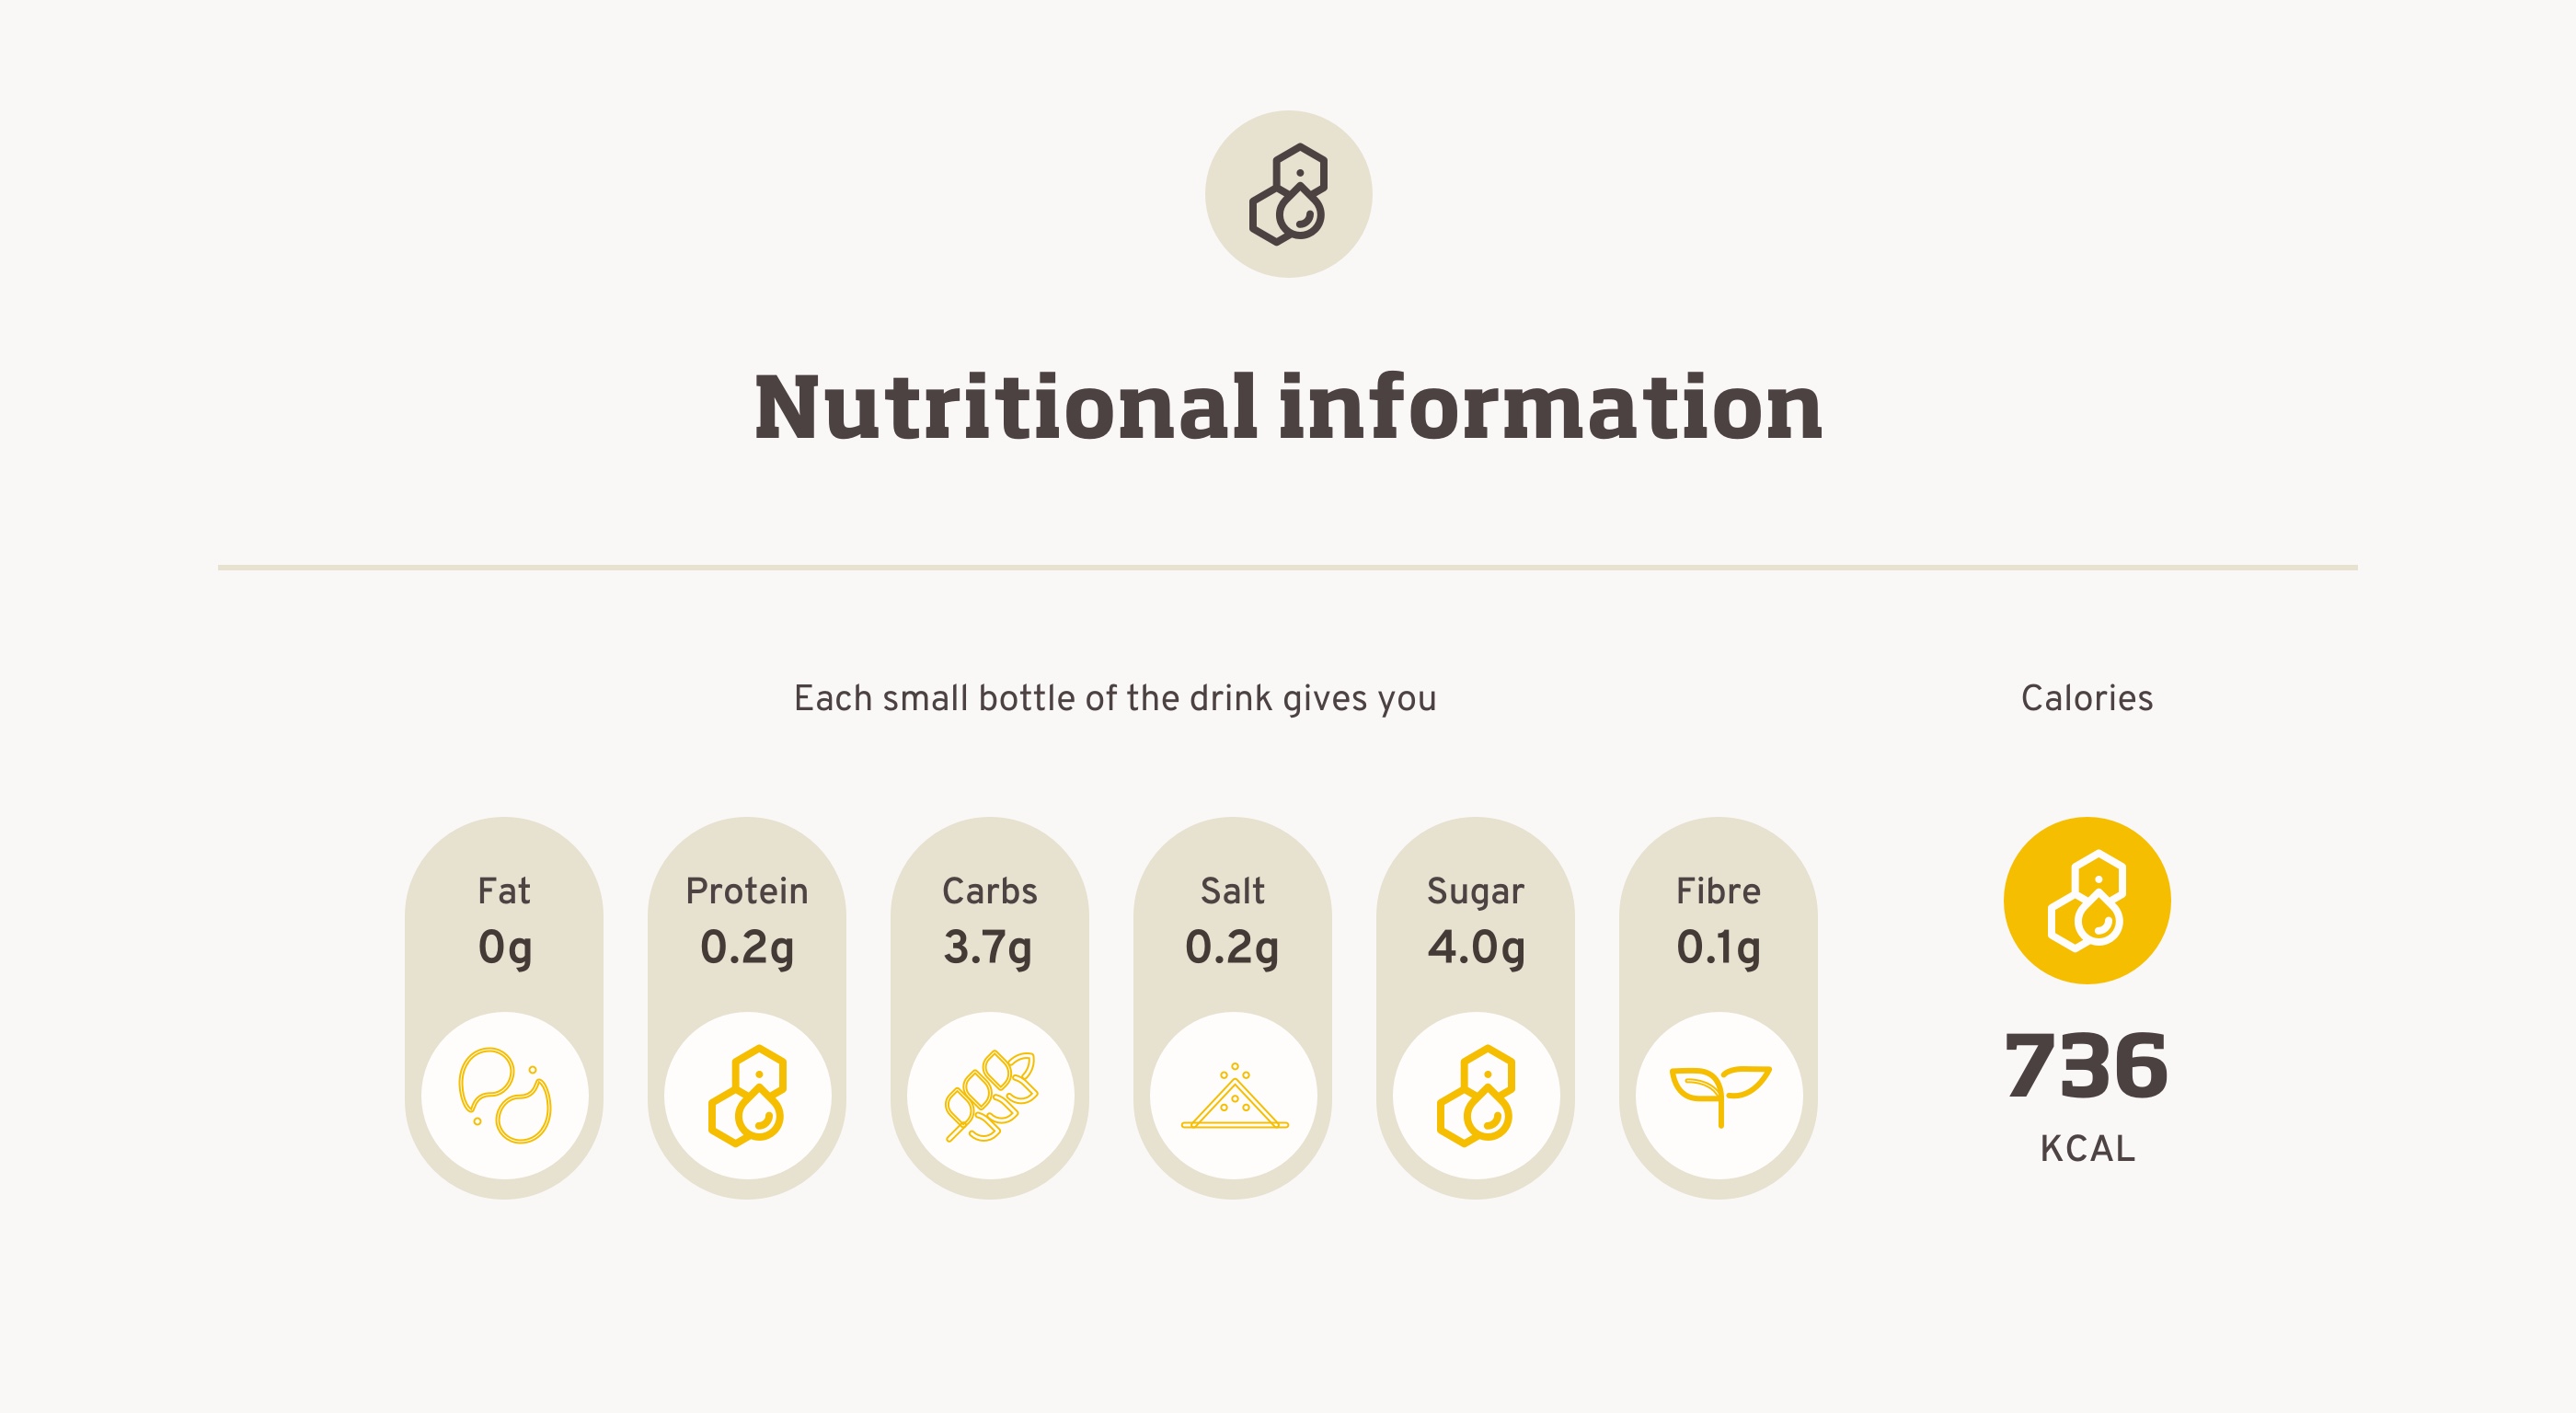
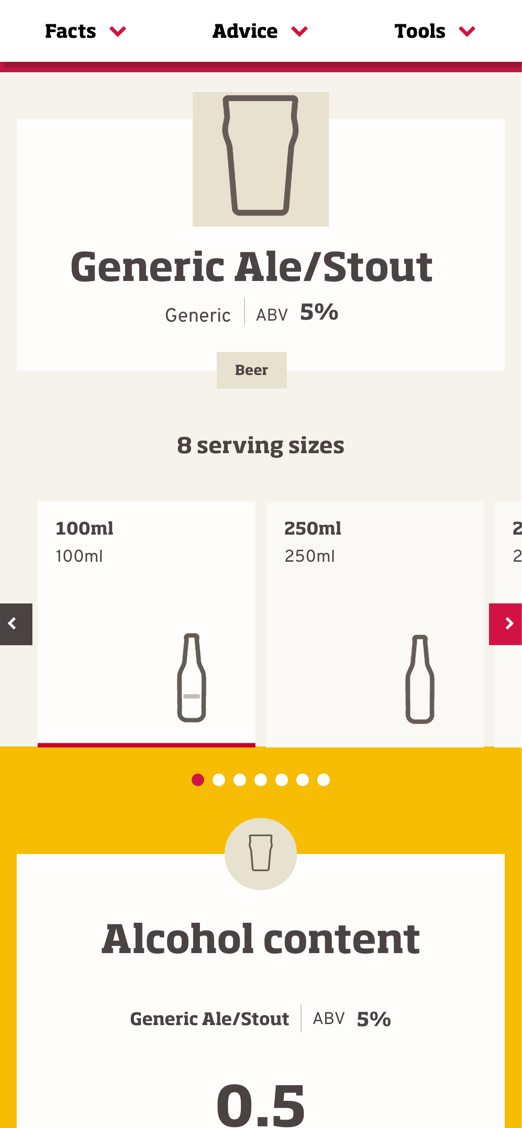
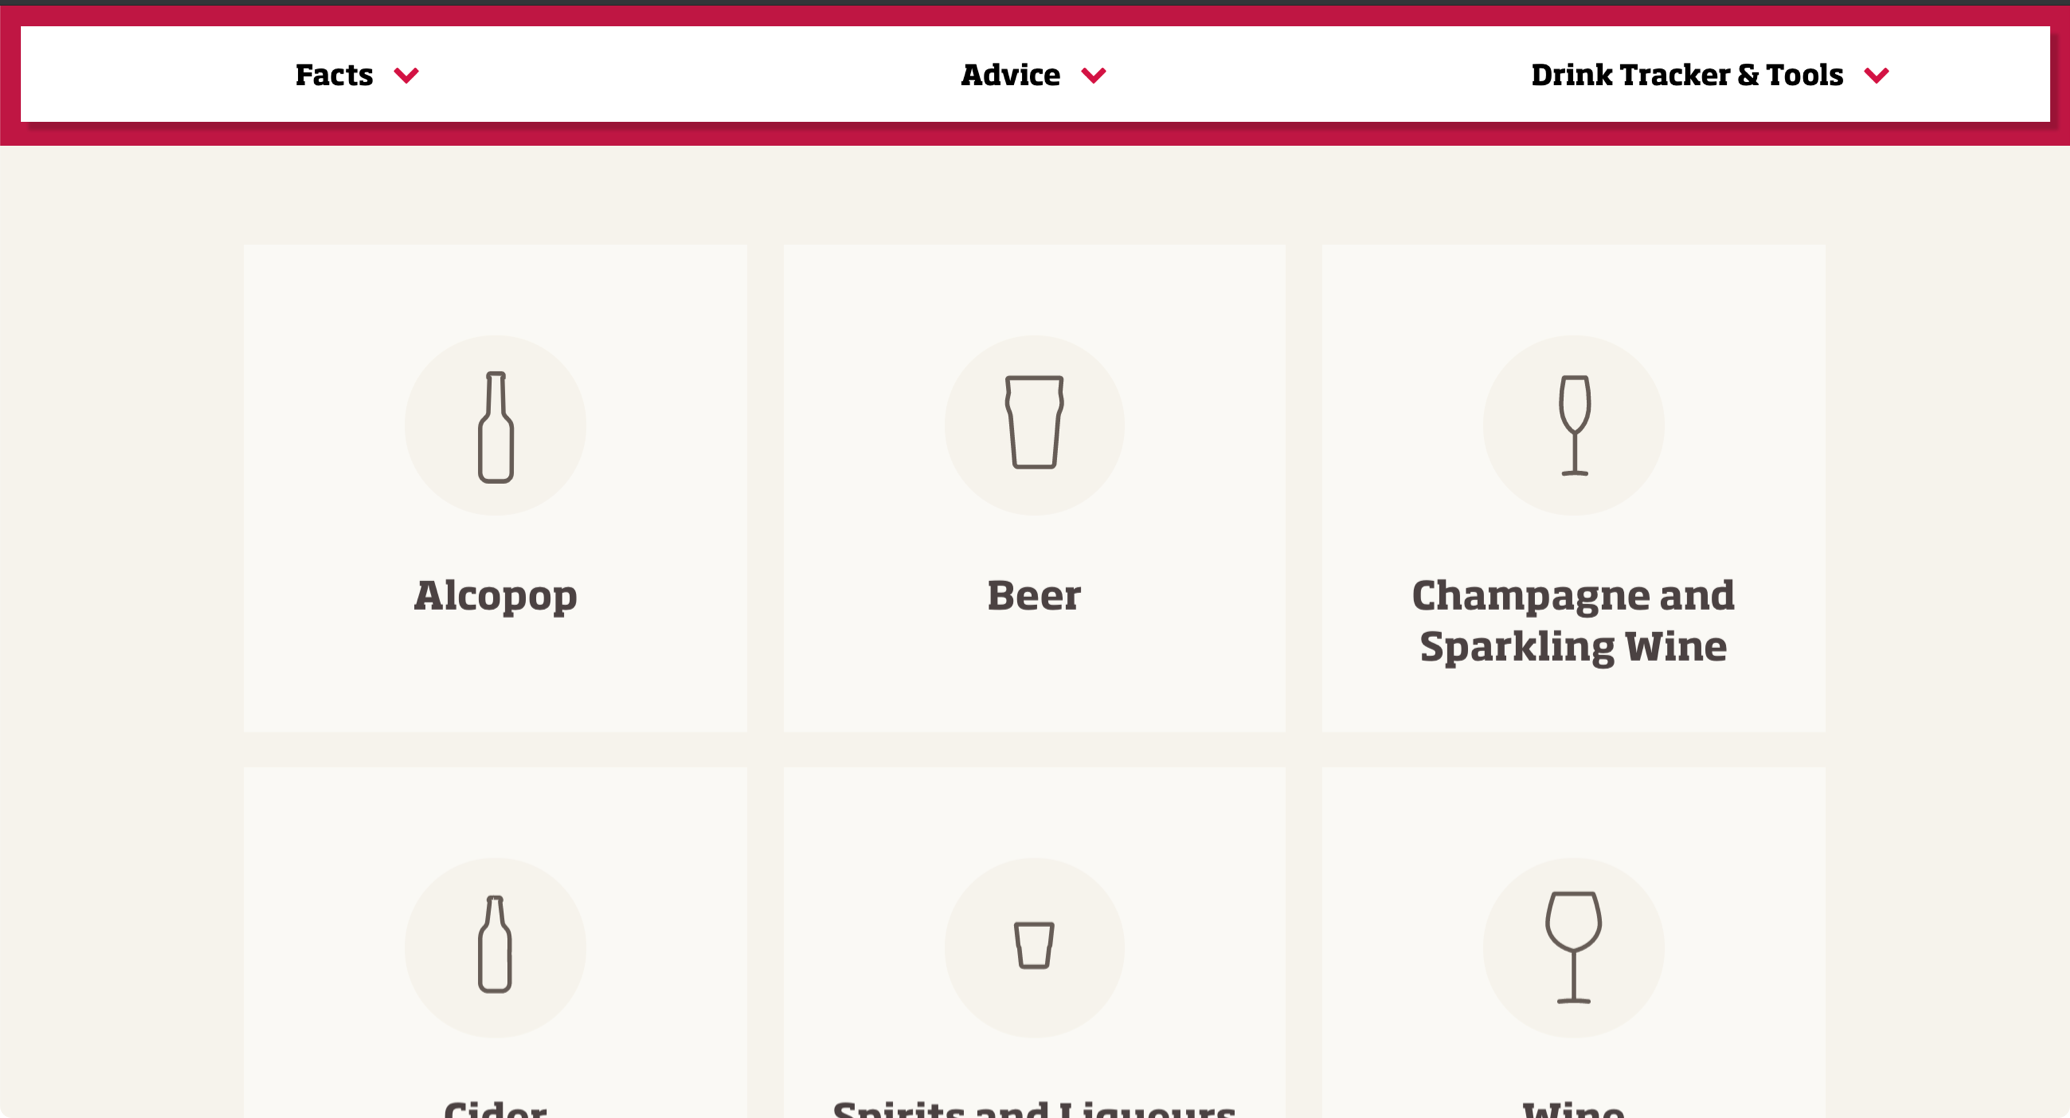
People are already used to seeing nutritional information on their food, so why reinvent the wheel? The layouts mirrored what people would already be familiar with, showing information by drink size gave them accurate information at a glance.
It was important to stay impartial. We wanted to show what was in the drinks but let the consumer decide what to do with this information.
Growing the design
We provided a slick design layer for the tool which introduced new visual assets to extend the existing brand guidelines. The design system hadn’t changed in a while so each project we worked on gave us the opportunity to introduce incremental additions and keep things fresh.
Find out what’s in your drink 🍻