Tools for business management
As you may have noticed, we talk about building digital tools a lot. We’re kind of obsessed with it.
We’re also pretty obsessed with staying on top of what we do by reporting well, using data to the fullest possible extent and having total visibility of information. We’ve felt strongly about this ever since Lighthouse was just two jokers in a room back in the mists of time – it’s not just something big businesses need to do, it’s a habit to instill from the start.
The landscape for business management tools is an exciting place at the moment. There are more and more applications and services available to help forward-thinking businesses organise and visualise the data. Any business concerned with efficiency and profitability should be taking advantage of these.
Here’s just a tiny snapshot of a few we rely on daily:
- Everyone’s workload is managed using Asana tickets 🗂
- We record all our time in Everhour ⏱
- Our sales pipeline flows through Pipedrive 🧾
- Abstract provides a single source of truth for our design work 🎨
Don’t reinvent the wheel
For the majority of cases, there will be digital tools out there that will do 99% of what you need it to. It goes without saying that as a business it makes sense to use what already exists if it’s a more-or-less perfect fit.
Even if you theoretically can, there usually isn’t a need to reinvent the wheel. The point of using any tool is to save you time and effort, not waste it.
We probably couldn’t build something better than Slack for our internal chat, and we don’t need to try.
Having said all that, there is a ceiling that some products hit. Some teams have unique use cases and niche industries often throw up unexpected requirements. You may also find a specific task crops up that either can’t be done in the digital tools you have in place or that simply take too much time using the existing methods.
That’s where you’re going to want to take things to the next level with integrations.
Integration, integration, integration
Most, if not all, of the digital tools we all use day to day already have an enormous array of other applications that can function completely within or as a bolt on to them.
Pipedrive, for example, boasts 212 different ways to connect to other services, and at Lighthouse Asana coupled with Everhour underpins most of what we do on project delivery.
Sometimes these integrations come out of the box but not every tool has the backend resource or need to offer these as standard.
Zapier (apparently pronounced to rhyme with ‘happier’ – who knew?!) is another absolute lifesaver. It allows end users without any coding know-how to integrate the tools they use, and should definitely be your first port of call to make a platform more powerful.
Chances are, you’ll find a straightforward way to stretch the capabilities of the tools you’re using, to unlock their power and amalgamate them into one mighty unit like Voltron.
But what if you can’t do this as easily though? If you need two products to integrate in a way that no-one has needed before, you can still use a tool’s API to pull out what you need and get one talking to the other. Building bespoke layers on top of your digital tools can be a neat way to bring extra value to your organisation while not breaking the bank.
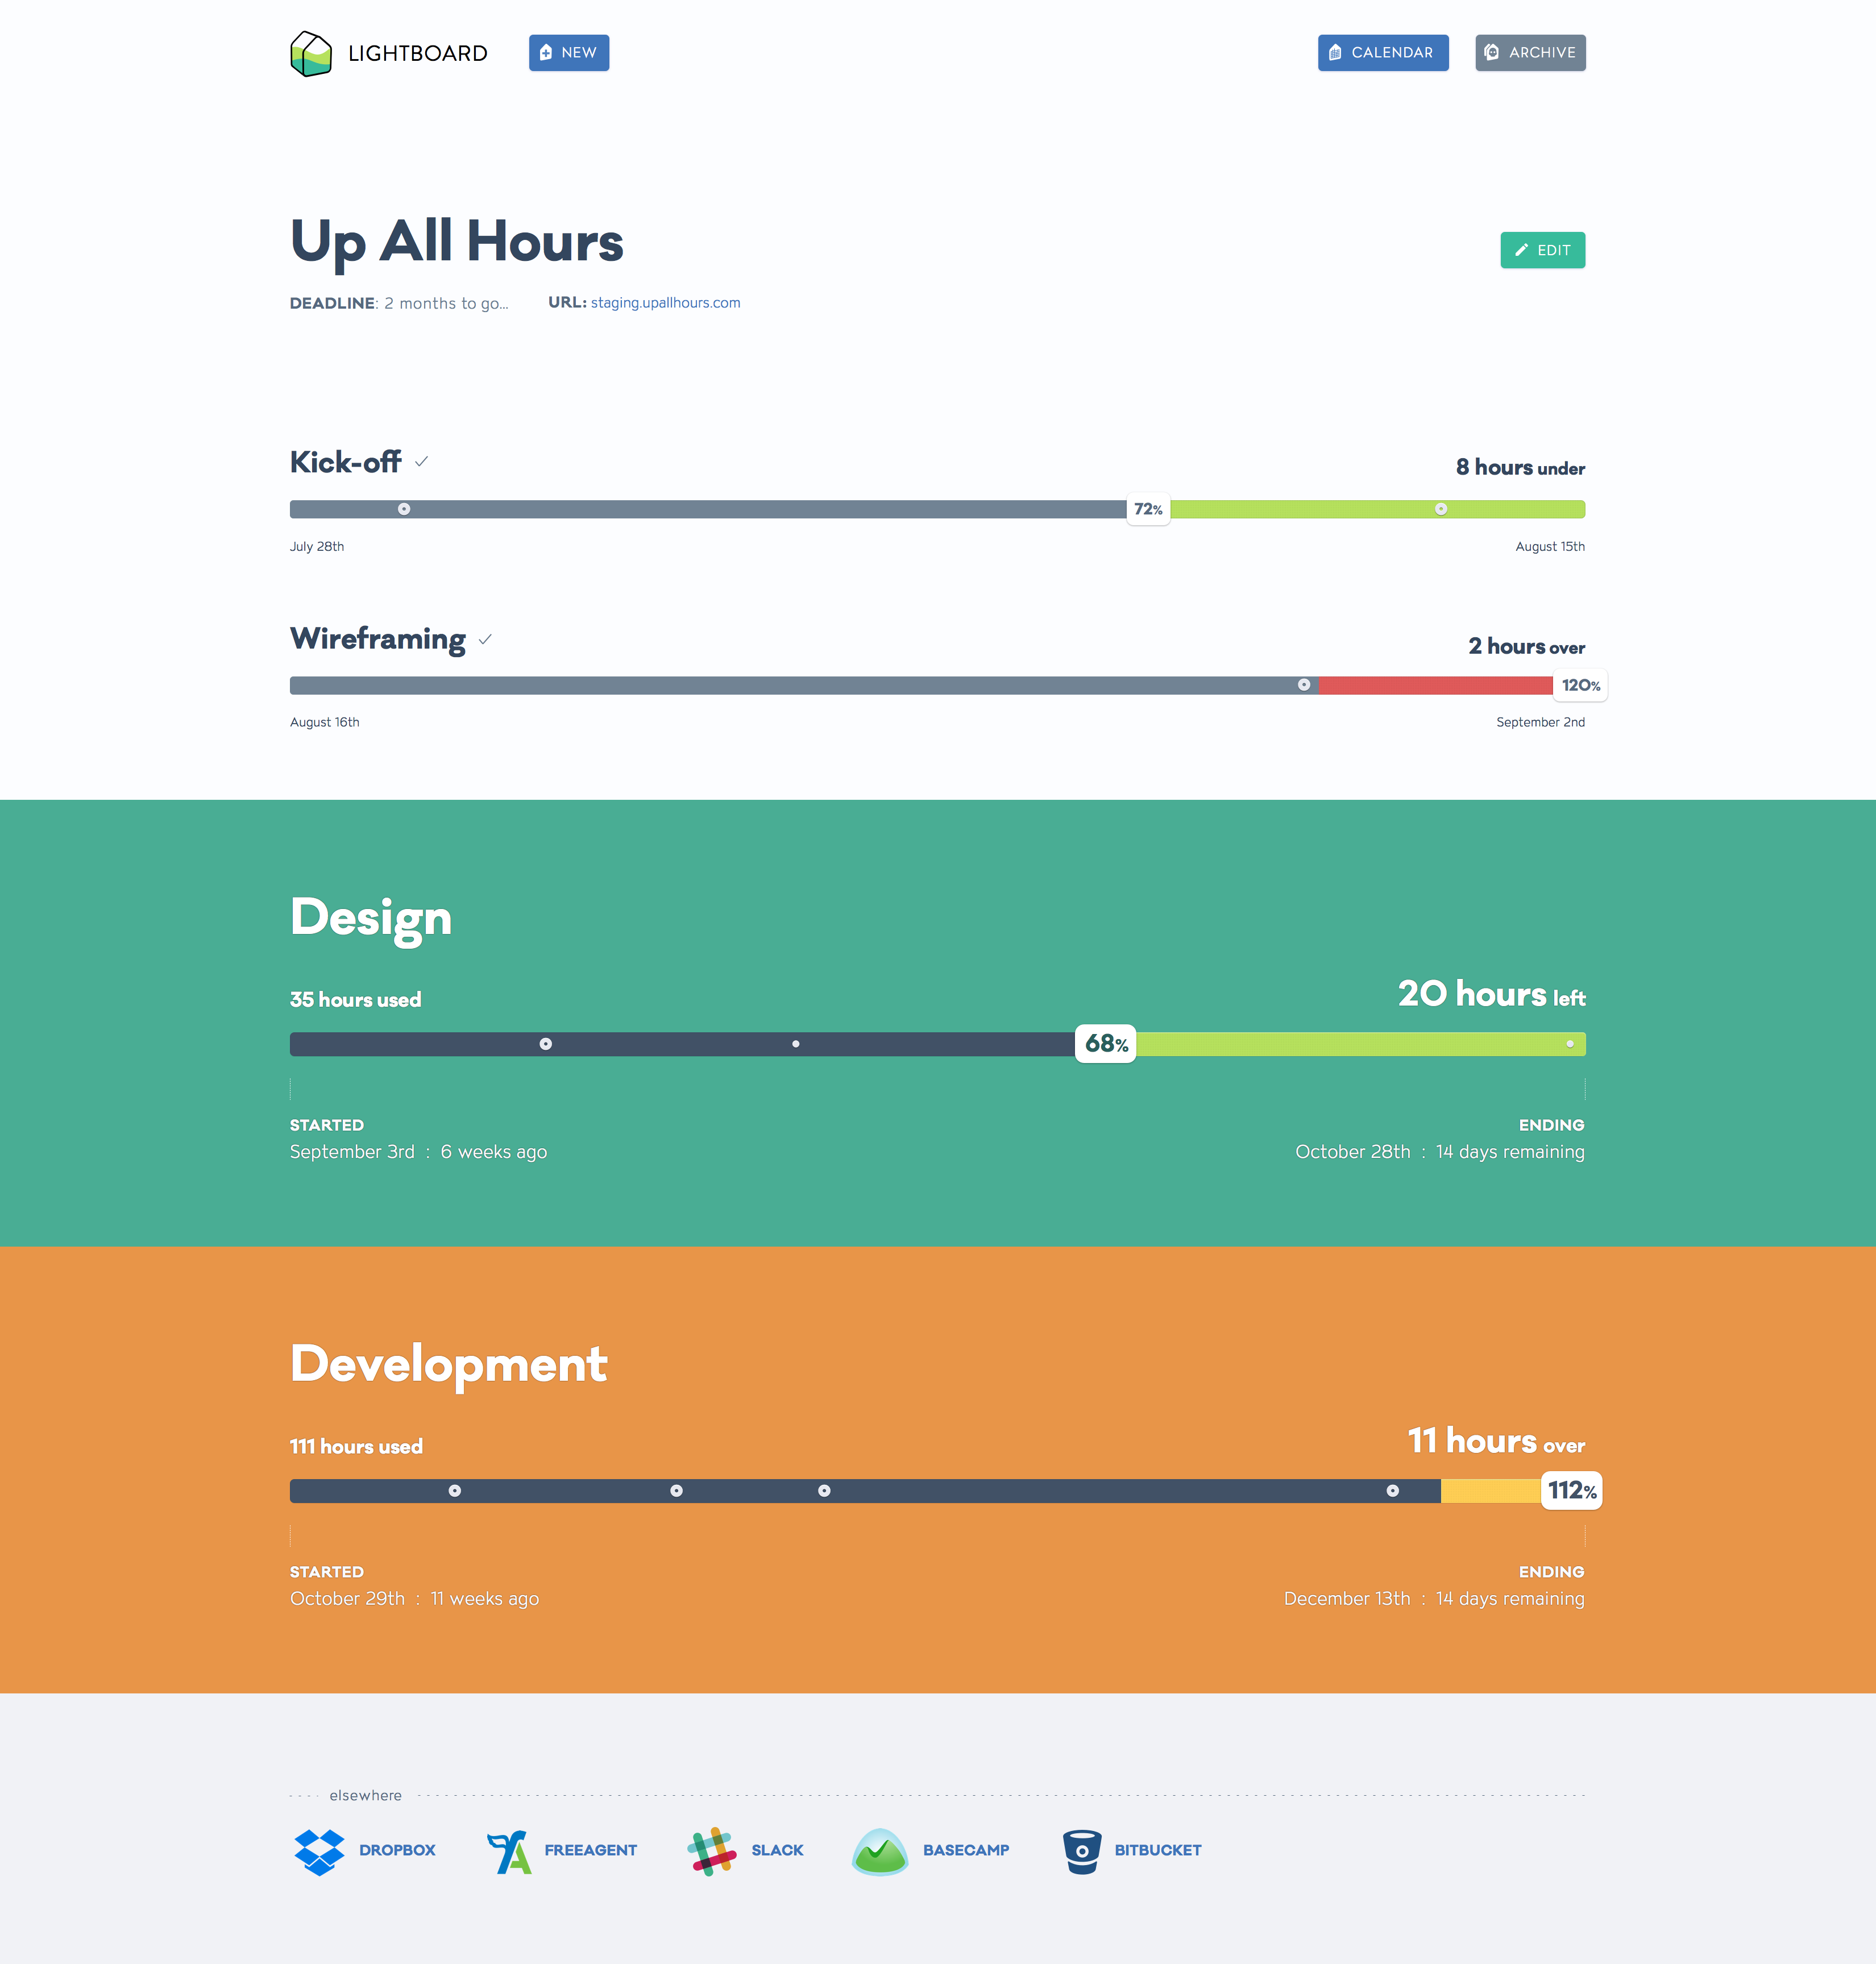
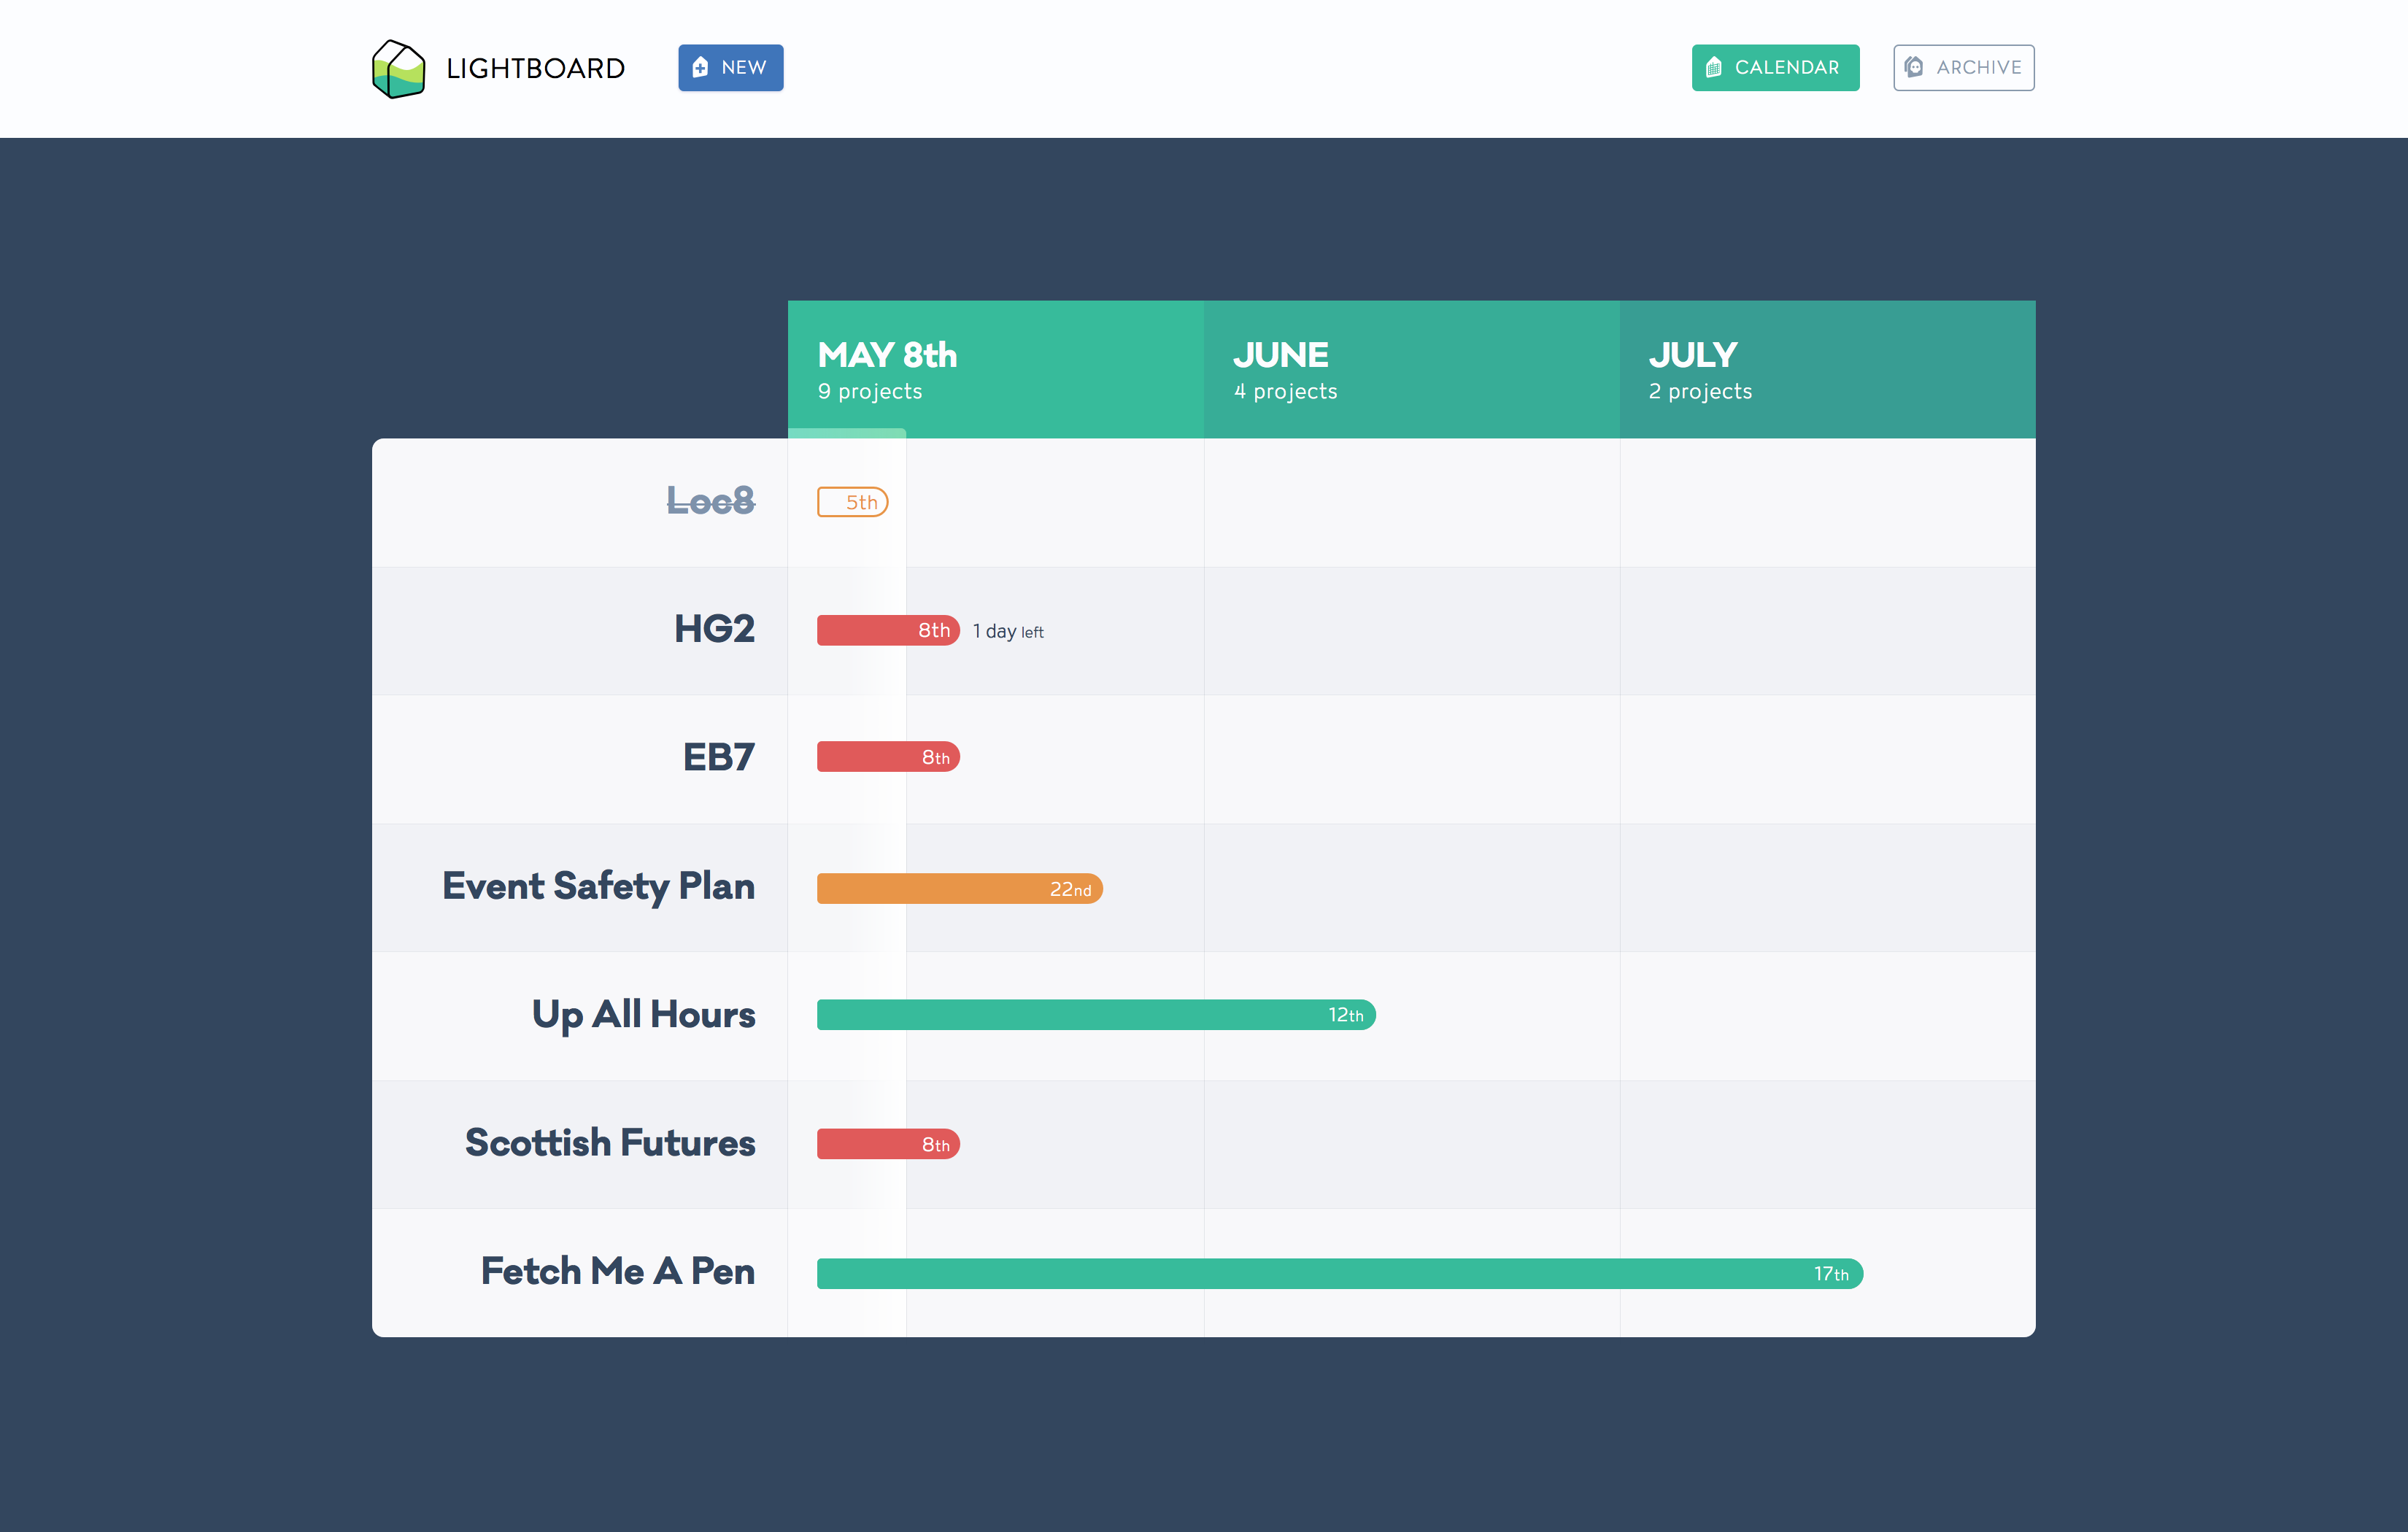
That’s just what we did with Lightboard.
The Lightboard story
A couple of years ago we had a problem where projects were running over budget too often. Clearly something was going wrong with the way we were keeping track of things.
We traced the root of the issue to a lack of visibility; although we were tracking our hours, the amount of time being used on each project couldn’t be accessed by everyone as it was trapped inside our accounting package at the time, FreeAgent. 😫
All the data was there, accessible via the FreeAgency API. It was just a case of finding a way to efficiently extract it and present back to the team in a way that was helpful.
The result was a simple dashboard that could be accessed by the team at any point to see time used, who’d been working on what and how recently a project had been worked on. It also let us break projects down by phase to better see how each was progressing, something that was possible with the data but impossible with the current tools.
In the weeks after we finished the tool we saw an almost immediate improvement in project profitability across the board. It also meant that we could identify project budget risks much quicker and flag up with clients. Being able to see what other people were working on meant far smoother collaboration between the team and a reduction in management time required to stay on top of this.
Sometimes the tools that already exist don’t give us the view we want, and that’s the point to start digging into the options to allow it.


Why does all of this stuff matter?
Ultimately, running a business depends on staying informed. A good product team chooses tools that aid them in that, and that can provide the insights they need in the simplest way possible. A single dashboard that visualises everything that’s going on has got to be preferable to 20 different logins and making yourself a spreadsheet, right?
This becomes even more pressing when teams are distributed and you can’t just glance over a designer or developer’s shoulder or quickly ask them what they’re working on. Intelligent use of the tools available, with customisation where needed, is the key to keeping on track.
Are you getting the insight you need from the effort you’re putting in? We’re always around to share what works and what doesn’t from our experiences, and the products we rate or hate.